


Mystery Shopping for
ONNIT
Take the mystery out of your consumer experience. Stord analyzed the entire pre-purchase through post-delivery experience for you and 2 of your competitors.
Orders were placed on September 16th-17th, and shipped to three locations across the United States (California, Texas and Georgia).


How Our Mystery Shopping Works
We analyzed the most important components that influence a positive consumer experience.
PRE-PURCHASE
Your product details experience, in-cart experience, shipping options, and fees.
SHIPPING & TRACKING
The accuracy of your delivery date, communication, and overall quality.
POST-PURCHASE
Ease of communication and resolution for returns, missing, or damaged orders.
COMPETITOR ANALYSIS
We applied the same rigorous testing of over 250 different metrics to two of your competitors.
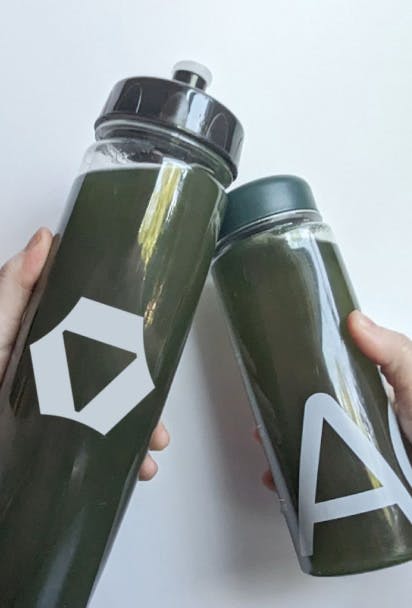
UNBOXING
The caliber of the packaging, branding, and inserts.


Your Score Details
Take a detailed look at nearly 30 distinct elements of your consumer journey starting with your pre-purchase experience through to your unboxing and beyond. Benchmarked against industry best standards.
What We Looked For | What We Found | Thesis | Thorne |
|---|
Pre-Purchase Experience
Inventory Availability  70.19% of carts are abandoned due to slow shipping options, fees, and more. Having automated reminders, offers, and win-back campaigns can dramatically improve your conversion rates and marketing ad spend. |  | | |
Abandoned Cart Reminders 70.19% of carts are abandoned due to slow shipping options, fees, and more. Having automated reminders, offers, and win-back campaigns can dramatically improve your conversion rates and marketing ad spend. | |  | |
Shipping Options 18-24% of consumers will abandon their cart because of slow shipping. Having clear, accurate, and numerous options put your customers in control and increase conversion. | UPS, USPS | Standard, Priority, 2 Day | Ground, 2 Day, Overnight |
Carbon Neutral Shipping 65% of shoppers have said they want buy from brands that advocate for sustainability. Being transparent with your efforts to combat climate change can reduce friction in the checkout process. | | | |
Delivery Promise 14% of consumers will never shop with a brand again if a delivery is late just once. Unclear promises can harm your brand as well. You must set clear expectations, ideally not showing the service level or the number of business days but rather the estimated date of arrival for the best experience. | 2-8 Days | 2-7 Days | 1-7 Days |
How Much is Shipping? 47-60% of online shoppers will abandon their cart due to high shipping costs and fees. Accurately displaying these costs can help mitigate churn. | $8-$20 | $0-$45 | $0-$25 |
Free Shipping Threshold 62% of shoppers won't buy from a retailer if it doesn't offer free shipping. However, 47% of consumers will spend the minimum amount to get free shipping. This can be a great tool to drive greater sales and improve your consumer experience. | $100 | Given | Given |
Shipment Protection 1.7 million packages are lost or stolen each day in the USA. Providing customers a way to protect and easily resolve exceptions can boost conversion and brand trust, turning a bad experience into a great one. | | | |
POST-Purchase Experience
Post-Purchase Email Letting your customer know that their order has been received and in progress builds trust and confidence in your brand. | | | |
Post Purchase Text Giving consumers the option to receive text messages and/or emails further builds trust in your brand. | | | |
Shipping Update Email A shipping email with a tracking link and estimated delivery date presented in your branding is crucial. Shipment notification emails have a 91.4% open rate, so you cannot skip this. | | | |
Shipping Update Text Many customers prefer text over email, so having this option is crucial as some 52% of customers prefer SMS marketing over email. | | | |
Delivery Tracking Either incorporated into your email or supported on a separate portal, having extreme clarity here is key. Avoid confusion or fear by showing precisely what stage their order is at and when it will arrive. | | | |
Tracking Provider Providing real-time updates on the progress of their order builds confidence and mitigates where is my order tickets to your CX team. The more you control this step vs push to the carrier the better | USPS | N/A | FedEx, UPS |
Delivery Promise vs. Actual Delivery 14% of online shoppers will abandon you completely if you deliver late just once. When you make that promise you need to not break it. | | | |
Your Shipping Reliability
Your customers are everywhere and they expect their orders to arrive in 2 days or less, no matter where they are. That’s why we tested to 3 different locations across the United States.
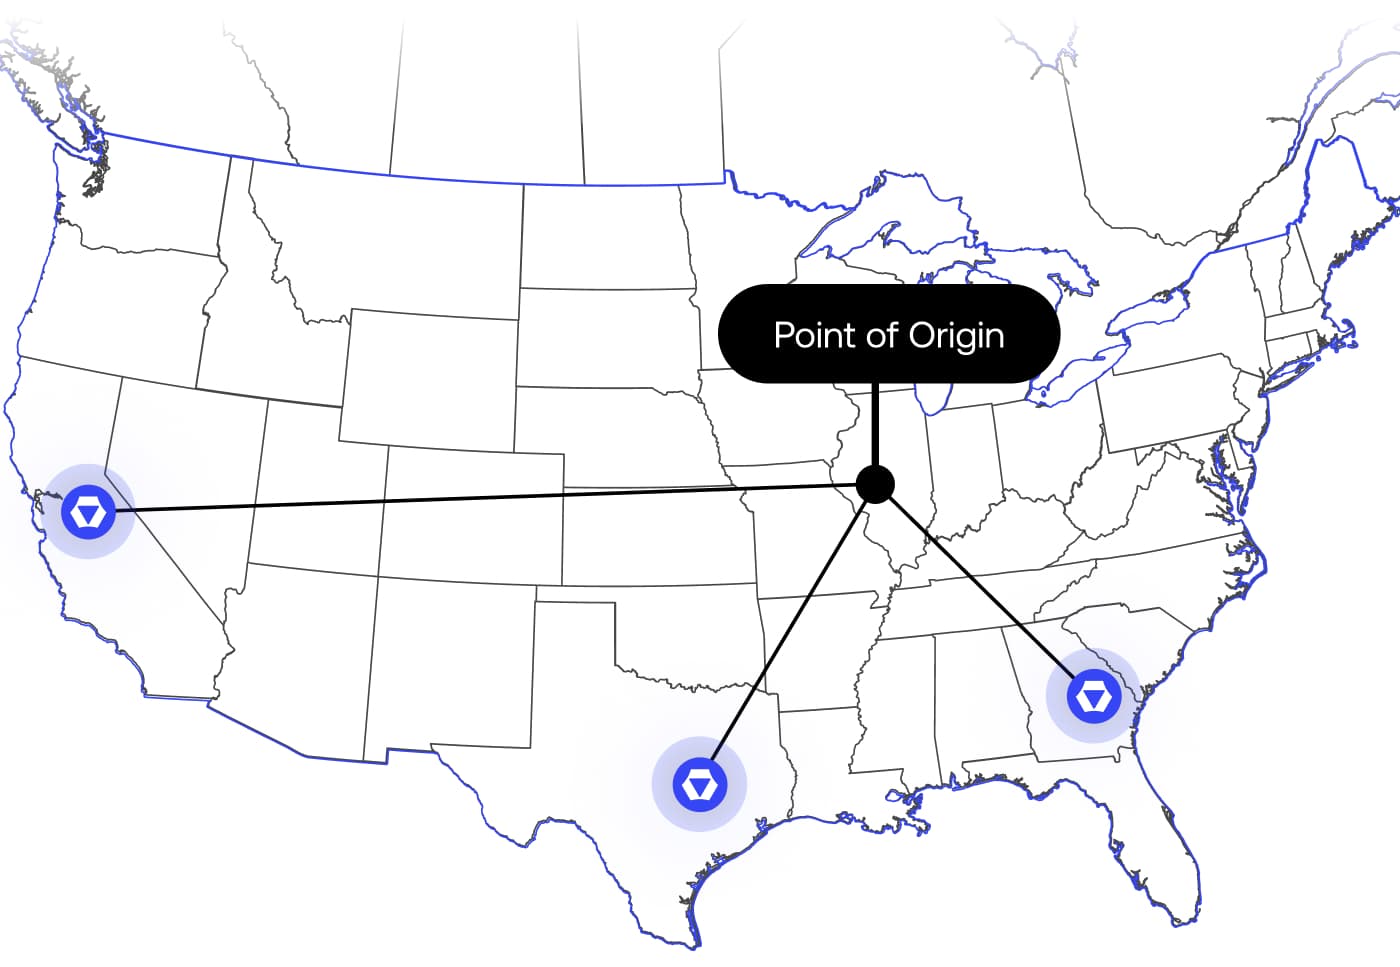
Destination
Campbell, CA
Destination
Austin, TX
Destination
Atlanta, GA
Order Details by Destination
Compare your brand to your competitors with a focus on differences experienced at various end destination.
| ONNIT | Thesis | Thorne |
|---|
Point of Origin The location where your inventory is stored and where the order was processed for delivery. | Edwardsville, IL | Avondale, AZ | Benicia, CA |
Time of Order When the order was submitted by your customer. | Afternoon | Afternoon | Afternoon |
Delivery Promise Your stated delivery promise - when can you customer expect their order. This number is reflective of the extrapolated number of days promised by your specific delivery promise. | 3-8 Days | 4-7 Days | 3-7 Days |
Click-to-deliver Timing When the carrier has officially delivered the order at your customer doorsteps. | 5 Days | 5 Days | 4 Days |
Branded Box 52% of consumers are likely to repeat purchase if their delivery arrives in premium packaging. | Yes | Yes | Yes |
Appropriate Packaging Was the package the right size and style to efficiently and safely reach your customer? | Yes | Yes | No |
Condition Of Packaging The condition of the box or mailer when it arrived | Good | Good | Good |
Order Accuracy Where the products that were order properly picked and packed or did you send the wrong item(s)? | | | |
Condition Of Products Were the products in good condition, unused, and ready for your customer to enjoy? | | | |
Packing Slip An accurate accounting of all items within the order. | | | |
Samples / Inserts Additional pieces to help build brand loyalty - stickers, special offers, or samples are common options. | | | |
Overall Unboxing Experience | Good An above average execution but there is still potential improvements that could be made to enhance your consumer experience. | Good An above average execution but there is still potential improvements that could be made to enhance your consumer experience. | Good An above average execution but there is still potential improvements that could be made to enhance your consumer experience. |
Your Unboxing Video
Take a look at a real end consumer experience when unboxing your products at our Atlanta location. The packaging experience is an extension of your brand and needs to delight.
Improve Your Consumer Experience
Expensive Shipping
47% - 60% of online shoppers will abandon their cart due to higher shipping costs and fees.
Solution
Offering free shipping, or order value-based free shipping, can dramatically boost conversions and revenue.
Limited Carrier Network
Using one or a small number of carriers leaves you exposed to drastic general rate increases, limited service level options, and diminished special services for specific product types.
Solution
Stord's massive network of local and national parcel carriers unlocks intelligent selection of the right carrier based on cost and delivery date. Protect your margins while ensuring you hit your promised delivery date without sacrifcing quality.
Long Delivery Time
18-24% of consumers will abandon their cart due to slow stated delivery promises.
Solution
An expansive offering of carriers allows for better selection and faster delivery with better unit economics.
All of these insights are from publicly available information, but many more opportunities exist to improve your consumer experience.
Schedule time to dig deeper into your data.
Our Report Methodology
How did we calculate your overall score?
Out team of experts analyzed over 250 different components across you and your competitors pre-purchase through post-delivery experience. Each of these elements are measured against industry-leading best-practices so we can calculate a comprehensive comparison for each key aspect of your consumer journey and an overall score of your consumer experience. From the efficiency of your corrugate to the effectiveness of your SMS campaigns, this is a truly exhaustive look at the quality of your end-to-end consumer experience.